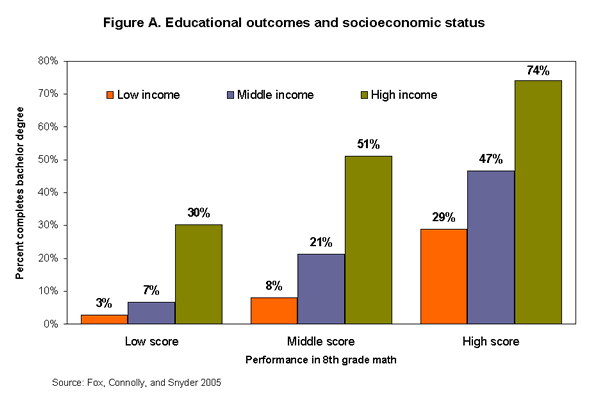
"Figure A shows the percentage of people who have completed a college degree. It groups them into quartiles (groups of 25%) based on their performance in 8th grade mathematics and their SES. There are three test score groups—low score (kids scoring in the bottom quartile), middle score (kids scoring in the two middle quartiles), and high score (kids scoring in the top quartile). In each test score group (low, middle, and high) there are three bars shown, one for those in the bottom quartile in terms of SES (low income), one for those in the two middle quartiles in SES (middle income), and one for those in the top quartile (high income)."
from "Low income hinders college attendance for even the highest achieving students"

No comments:
Post a Comment